American Indian (AI) youth consistently report high levels of substance use, with rates having exceeded national rates for decades. The Our Youth, Our Future study represents an on-going effort to provide better adolescent substance use data to tribes, schools, funders, and other decision makers because it focuses exclusively on youth who live on or near reservations.
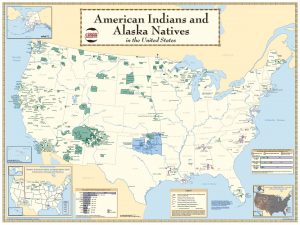
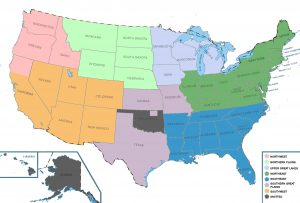
Each year, we survey approximately 30 schools (with grades 7 or above). These schools are randomly selected from schools located on or within 25 miles of a reservation or tribal lands, with at least 20% AI students enrolled. Schools outside the continental US are excluded, as are Oklahoma Tribal Statistical Areas. For more information on survey methods, click here.


Participation in the survey is voluntary, and appropriate tribal and school board approvals are obtained. Each school receives a comprehensive report of their school’s survey findings. Specific identities of schools, tribes and reservations are kept confidential.
The OYOF survey contains a verbatim subset of substance use questions asked in the Monitoring the Future (MTF) study which each year surveys a national sample of secondary school students. Below we present academic year 2016-2017 OYOF findings for 8th, 10th and 12th grade students self-identifying as AI. For each substance, these are then compared to 2016 MTF findings. Complete tables with all substance use measures can be found here and here.
Past 30-day Substance Use
A trend can be seen in the results below. The largest disparity between American Indian and Monitoring the Future students occurs at the 8th grade, with less differences between these groups at grades 10 and 12. Several factors are likely responsible for this trend, including earlier initiation of substances by American Indian youth (Stanley & Swaim, 2015), and the higher rate of school dropout among American Indian youth (Swaim, Beauvais, Chavez, & Oetting, 1997).
Marijuana Use
30-Day Prevalence for Marijuana Use - AI Compared to MTF
Over 4 times as many American Indian 8th graders reported marijuana use in the last 30 days (22.5%) compared to use reported by Monitoring the Future 8th graders (5.4%). The ratio between AI and MTF rates was less for 10th and 12th graders. However, AI students still reported significantly more use in the last 30 days. For example, 35.1% of 10th grade AI students reported marijuana use in the last 30 days while 14% of MTF 10th graders reported last 30-day use.
Alcohol Use
30-Day Prevalence for Alcohol Use - AI Compared to MTF
American Indian 8th graders reported just over double the prevalence of alcohol use in the last 30 days (15.8%) compared to use reported by Monitoring the Future 8th graders (7.3%). The ratio between AI and MTF rates was much closer for 10th graders, with AI 10th graders (24.1%) still reporting slightly higher use compared to MTF 10th graders (19.9%). However, MTF 12th graders (33.2%) reported slightly higher use than AI 12th graders (30.7%) for last 30 days.
Gotten Drunk
30-Day Prevalence for Gotten Drunk - AI Compared to MTF
Over 5 times as many American Indian 8th graders (9.6%) reported getting drunk in the last 30 days than use reported by Monitoring the Future 8th graders (1.8%). AI 10th graders (16.5%) also reported significantly higher rates than MTF 10th graders (9%). 12th graders for AI (23.2%) and 12th graders for MTF (20.4%) reported similar ratios, with AI being only slightly higher than MTF.
Binge Drinking
30-Day Prevalence for Binge Drinking - AI Compared to MTF
Prevalence for binge drinking in the last 30 days was significantly higher for American Indians across grade levels. 8th Grade AI (11.8%) reported more than three times that of 8th grade MTF (3.4%). 10th grade AI (16.6%) and 12th grade AI (22.8%) reported last 30 days binge drinking were also much higher than 10th grade MTF (9.7%) and 12th grade MTF (15.5%).
Cigarette Smoking
30-Day Prevalence for Cigarette Smoking - AI Compared to MTF
Over 4 times as many American Indian 8th graders reported cigarette smoking in the last 30 days (10.6%) compared to use by Monitoring the Future 8th graders (2.6%). Slightly more than 3 times as many AI 10 graders reported cigarette smoking in the last 30 days (15.1%) compared to use by MTF 10th graders (4.9%). The ratio between AI and MTF was less for 12th graders. However, AI still reported more than double the cigarette smoking in the last 30 days (23.1%) compared to MTF 12th graders (10.5%).
Illicit Drug Use (Not Marijuana)
30-Day Prevalence for Illicit Drug Use (Not MJ) - AI Compared to MTF
More than double the American Indian 8th graders reported Illicit Drug Use (6.4%) compared to 8th graders who took the Monitoring the Future survey (2.7%). 10th and 12th grade ratios between AI and MTF were closer. However, AI students still reported higher use. 6.7% of 10th grade AI reported using illicit drugs in the last 30 days, while 10th grade MTF students reported 4.4%. 9.7% of 12th grade AI students reported illicit drug use in the last 30 days, and 12th grade MTF students reported 6.9%.
Inhalants Use
30-Day Prevalence for Inhalants Use - AI Compared to MTF
Inhalants use in the last 30 days is the only category where both American Indian and Monitoring the Future 8th grade students reported higher use than 10th or 12th grade students in their respective categories. Even so, nearly three times as many AI 8th graders (4.9%) reported using inhalants in the last 30 days compared to Monitoring the Future 8th graders (1.8%). The ratio was less, but still more than double that of AI to MTF usage in both 10th and 12th grades. 2.2% of AI 10th graders reported last 30 day inhalants use compared to 1% of MTF 10th graders. And, 2.1% of AI 12th graders reported last 30 day inhalants use compared to .8% of MTF 12th graders.

